For a report at my work (at a callcenter) I had to create a chart with a percentage of failed calls per agent per day. This chart also had to contain 1 line which represented the weighed average percentage of failed calls of all the agents. This could not be done with calculated series because the percentage would not be a weighted average.
By the way for those who don’t know what a weighted average means. Imagine you have 2 agents:
Agent 1, 2000 calls, 2% fail
Agent 2, 10 calls, 40% fail
You cannot simply add 2% and 40% and divide it by 2 (21%). The 2% failed calls of agent 1 weighs much more than the 40% failed calls of agent 2 which only did 10 calls. So to get a weighed percentage you have to add the number of total calls and the number of total fails and get a percentage of that. In this example the failed call percentage would be 2.189055%. Dataset 2 calculates the weighed percentage.
So after some trial and error I found a way to accomplish this in SRSS 2008. There are 2 datasets which output the following data:
Dataset 1: input (from date, to date, (agent 1, agent 3, agent 10))
Outlput:
| Date | Agent | % of failed calls |
| 20120701 | Agent 1 | 1 |
| 20120701 | Agent 2 | 4 |
| 20120701 | Agent 3 | 2 |
| 20120702 | Agent 1 | 0 |
| 20120702 | Agent 2 | 5 |
| 20120702 | Agent 3 | 2 |
| 20120703 | Agent 1 | 1 |
| 20120703 | Agent 2 | 7 |
| 20120703 | Agent 3 | 2 |
Dataset 2: input (from date, to date)
Output:
| Average % of Failed calls |
| 2% |
Let’s presume there are 50 agents in database. Dataset 2 returns the average of all these 50 Agents.
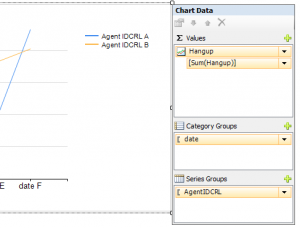
Now we create a (line) chart (% of failed calls is called Hangup in this example):

Now to add a line which represents the average value from Dataset do the following:
– Click the + button next to Values
– Choose expression
– Type the following: =Sum(Fields!Hangup.Value, “Dataset2”)
– Click OK
So one thing has to be done:
– Right click the new created series and choose series properties
– Choose visibility and choose “Show or hide based on an expression”
– Use the following expression: =IIF(RowNumber(Nothing) = 1, False, True)
– Click ok and go to “Legend”. Here you can enter a custom legend text like “Avarage % of failed calls”
– Click ok and you’re finished!
Good luck!

